全球交易商监管查询APP
什么是WikiFX

Spot Gold Price Chart Shows Parabolic Climb Amid Plummeting Yields
摘要:XAUUSD eclipsed the $1,320 price level as investor concern over slowing global growth has led to a collapse in long-term interest rates and another inversion along the US Treasury yield curve.
SPOT GOLD PRICE – TALKING POINTS
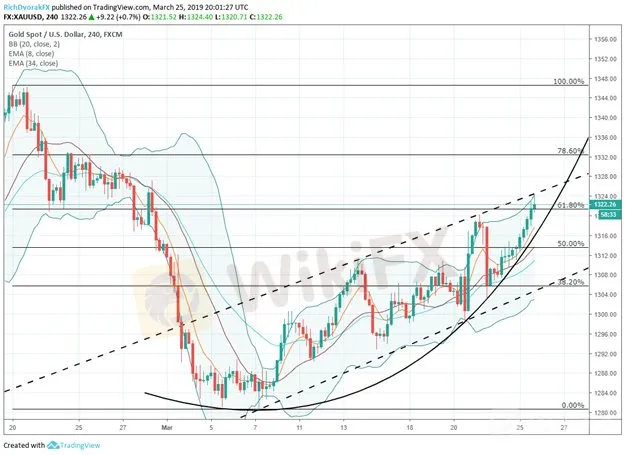
Gold jumped to $1,324 while the US 10-Year Treasury Yield dropped to its lowest level since December 2017
The recent ascent in XAUUSD appears to be driven by investors piling back into the anti-risk asset in response to a deteriorating global growth narrative
New to trading gold or looking to sharpen your gold trading skills? Check out this insight covering Top Gold Trading Strategies and Tips
The price of gold has risen to its highest level since February and pushed XAUUSD month-to-date performance back into positive territory. Gold has gained nearly 2 percent since prices based on March 7 as global growth forecasts continue to be revised lower. The Federal Reserve stoked the markets latest flare-up of pessimism last Wednesday when the FOMC released updated economic projections that cut 2019 GDP growth estimates from 2.3 percent to 2.1 percent.
SPOT GOLD (XAUUUSD) PRICE CHART: 4-HOUR TIME FRAME (FEBRUARY 19, 2019 TO MARCH 25, 2019)
Although equity investors initially celebrated the Feds latest dovish position and easy-money monetary policy, risk assets have since come under pressure as markets attempt to gauge whether the economic slowdown is temporary or if a recession is right around the corner. It appears that sentiment is souring, however, judging by soaring US Treasuries. In fact, the yield on US 10-Year Treasury Notes plummeted from a high of 2.63 percent last week down to 2.42 percent today – its lowest level since December 2017.
Moreover, CME data shows the futures market is now pricing in a 75 percent chance that the Fed cuts its policy interest rate by the end of this year. A lower yield trajectory puts pressure on real interest rates which in turn boosts the relative attractiveness of holding gold considering the precious metal is a zero-yielding asset.
SPOT GOLD (XAUUSD) VS US 10-YEAR TREASURY YIELD PRICE CHART: DAILY TIME FRAME (DECEMBER 31, 2018 TO MARCH 25, 2019)

Although long-term rates have dropped significantly, a non-parallel shift in the yield curve – a 'flattening' where short-end rates are rising faster than long-end rates – hascaused portions of the US Treasury yield curve to invert. Notably, the 3m10s yield curve just inverted and is significant due to this event signaling a recession in the US within the next 24 months seven out of the last 7 times.
Consequently, this combination of lower long-term interest rates and increasing recession risk has bolstered gold prices. Now with XAUUSD looking like it has reasserted its claim above technical support near the $1,300 price level, the recent parabolic climb has potential to continue. Nonetheless, gold bulls could quickly exit speculative positions and send spot prices lower if global economic fundamentals start to improve from current expectations.
- Written by Rich Dvorak, Junior Analyst for DailyFX
免责声明:
本文观点仅代表作者个人观点,不构成本平台的投资建议,本平台不对文章信息准确性、完整性和及时性作出任何保证,亦不对因使用或信赖文章信息引发的任何损失承担责任
天眼交易商
热点资讯
WikiFX精英俱乐部精英委员会票选结束!首届名单正式揭晓
 WikiFX
黄金投资热?警惕币圈平台Bybit正在为你“量身下套”:被诱导交易500手,亏1万多刀返佣却一分不给
WikiFX《对话评委:天眼奖幕后》 —— Moneta Markets 创始人兼首席执行官 David Bily
WikiFX外汇天眼发布:10月客户投诉黑榜单TOP10
WikiFX券商免费赠送股票靠谱吗?看看XTB的各种套路
WikiFX汇率计算
CNY

USD
当前汇率: 0
请输入金额
CNY
可兑换金额
USD
开始计算